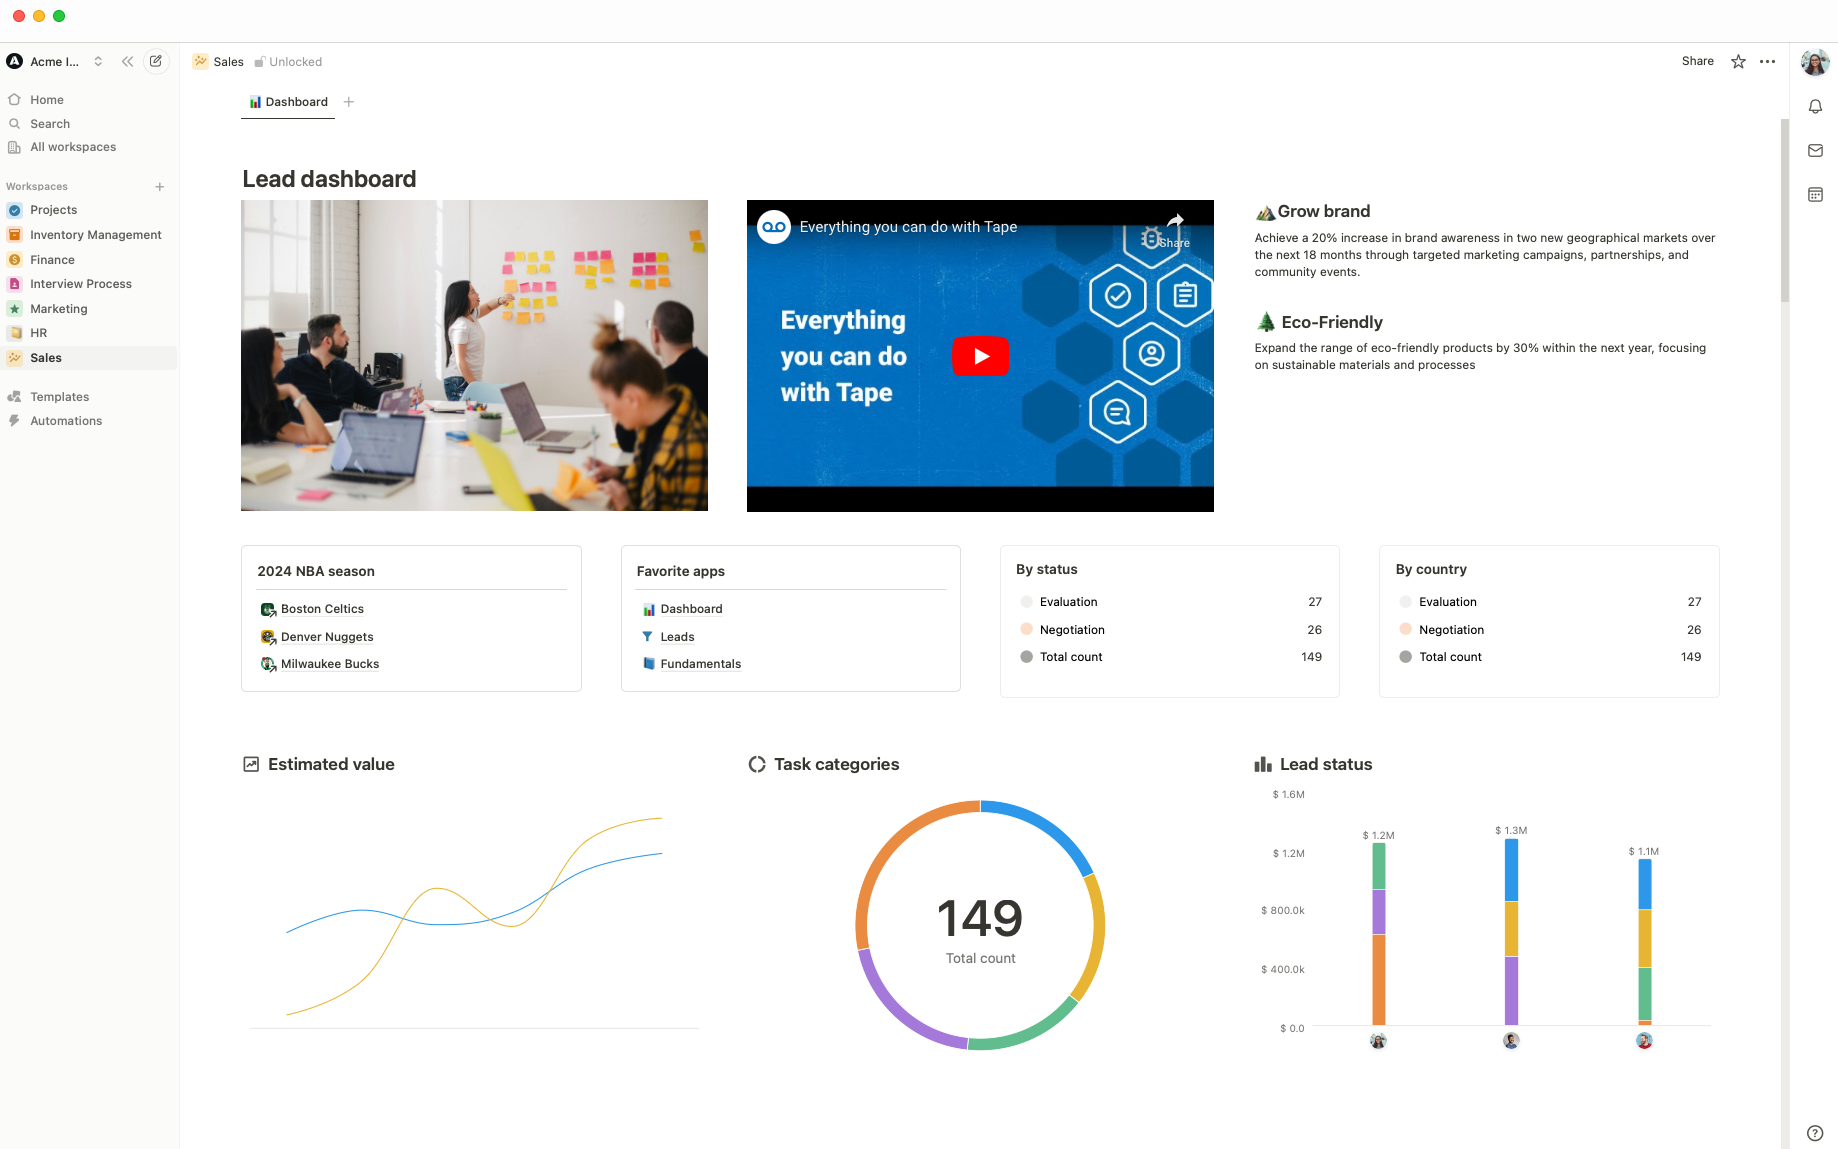
Tape's dashboards help your teams see, understand, and act on your data. Whether you need to track project timelines, analyze team performance, or simply make sense of large datasets. Dashboards transform your data into actionable insights, driving smarter decisions and better outcomes.
Create charts in seconds
Turn any database app into a chart with just a few clicks! When the source data changes, your chart will update automatically, and you can click any data point to review the underlying records instantly.
Use multiple charts to track everything
Nobody likes flipping between apps to stay on top of projects. Now you don’t have to: you can add multiple charts on a dashboard, then click and drag them anywhere to make a custom layout.
Customize your charts
Choose from bar, line, donut or pie charts and change color palettes, axis names, data labels, and more. Charts should be as beautiful as they are useful.
Build your perfect dashboard
Give your dashboard a big upgrade by adding list and number reports, images, links, text, and videos. Create a dashboard that’s simple yet powerful, tailored to your needs.
Call for Beta Testers:
Early access
The chance to shape our Workflow Automations
Fast access to the founding team
Regular exclusive insights & updates
Thank you all so far - for the incredible support. Together we can build great things.
By clicking “Accept All Cookies”, you agree to the storing of cookies on your device to enhance site navigation, analyze site usage, and assist in our marketing efforts.
This website uses cookies to improve your experience while you navigate through the website. Out of these cookies, the cookies that are categorized as necessary are stored on your browser as they are essential for the working of basic functionalities of the website. We also use third-party cookies that help us analyze and understand how you use this website. These cookies will be stored in your browser only with your consent. You also have the option to opt-out of these cookies. But opting out of some of these cookies may have an effect on your browsing experience.
Necessary cookies are absolutely essential for the website to function properly. This category only includes cookies that ensures basic functionalities and security features of the website. These cookies do not store any personal information.
Any cookies that may not be particularly necessary for the website to function and is used specifically to collect user personal data via analytics, ads, other embedded contents are termed as non-necessary cookies. It is mandatory to procure user consent prior to running these cookies on your website.